


Normally when we look at a graph that has an X axis and a Y axis, we see it go up in even increments like 1 2 3 4 5 6 7 8 9.
This isn't helpful for some things, for example in measuring how loud a sound is. For stuff like that we must go up exponentially like 1 10 100 1000 10000 100000. This is called a logarithmic graph. We also have logarithmic units, such as the "decibel" that's used for measuring sound.
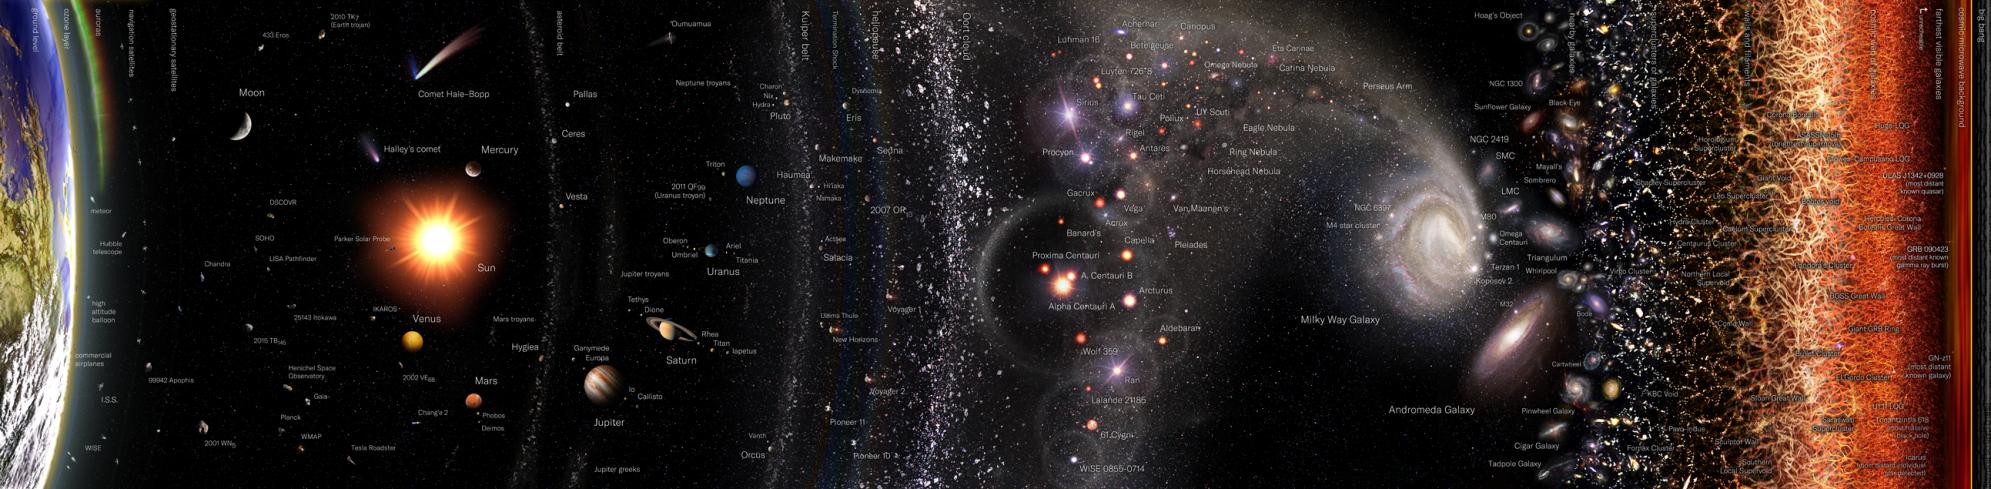
If we were to draw an accurate-to-scale map of the known universe, it would just be way too big... there's no way we could have Earth the size of a dime and also be able to see the next galaxy closest to ours.
So the solution is to draw a logarithmic map of the universe. As you move from Earth on the far left, toward the far-away galaxies on the right, the distance increases exponentially.
And here's what it looks like:

 Reply With Quote