


Kel, we got to get your graphs updated! Here's a great link for generating these Graphs: SteroidGraph - Graph your cycle
So, here's to answering the OP's questions with some graphs. Keep in mind that these graphs plot the theoretical release of molecular T (no ester) into your system based on published half life data. By comparison, the average male produces about 7 mg of T per day.
Here's what your T profiles looked like on your stone age 200 mg every 2 week protocol:
Here's what your T profiles look like on your still old school once per week 150 mg protocol:
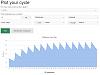
Here's what your T profile would look like if you broke that same 150 mg protocol into every 3 day (E3D) dosing:
Here's a better protocol that I recommend as a starting point for most guys. Dropping your T dose down to about 117 mg per week split up into E3D dosing of 50 mg.

 Reply With Quote